
Note: This is the last of a five-part series covering Kubernetes resource management and optimization. In this article, we take you step by step through one of the toughest Kubernetes optimization challenges — databases. Previous articles in the series explained Kubernetes resource types, requests and limits and using machine learning to automate optimization, and optimizing Java apps.
Since its inception, the use of automation in Kubernetes has made container management significantly easier. Though initially designed with stateless applications in mind, Kubernetes environments have since become home to various types of database technologies as well. Due to its ease of scalability and flexibility, database administrators can use Kubernetes to support the availability of SQL database clusters.
However, running a database in a Kubernetes environment comes with some unique challenges. Optimizing the performance of a database in Kubernetes has its trade-offs with the cluster’s resources.
This article discusses some best practices for optimizing database performance and making efficient trade-offs with resource use in a Kubernetes cluster. Then it demonstrates how to run a database on Kubernetes and shows how to view the effect on the cluster’s performance.
When running stateful components such as databases on Kubernetes, there are several steps we can take to balance and optimize trade-offs between performance and resource usage:
Since Kubernetes containers are more suitable for stateless workloads, running stateful resources requires tuning some elements to prevent data loss if the container fails. These components are StatefulSets, PersistentVolumes, and PersistentVolumeClaims.
The function of StatefulSets is to ensure ordered and unique pods. They are a set of object resource APIs that handle stateful applications. During the deployment of pods in stateful applications, each has a unique ID that enables reconnecting the pod to persistent storage when a pod fails.
Storage management is a considerable stressor in Kubernetes. To lessen this, we can use PersistentVolume (PV), which is independent resource storage in a cluster attached to a pod. We can provisionally configure PVs either manually or dynamically using storage classes. Using PV creates a PersistentVolumeClaim (PVC), which allows a specific user to abstract and consume PV resources.
If your organization runs its stateful workloads in Kubernetes, you must determine what type of database to run for optimal performance and resource use. Since pods are transient, the probability of failover is greater than with traditionally managed databases. Choosing a database with capabilities like horizontal sharding, replication (such as MongoDB or Cassandra) and failover elections is essential.
Databases that are not Kubernetes-friendly (such as MySQL and PostgreSQL) can use Kubernetes operators for database performance and maintenance tasks like backups and replication. MySQL operators include CrunchyData for PostgreSQL and Oracle MySQL. Operators add a layer of functionality such as sharding and leader election to deploy on Kubernetes successfully.
Load balancers are helpful if the app is in a different Kubernetes cluster. The ability to expose the database externally increases your application’s reliability for its users. You can use network load balancers (NLBs) on various public cloud providers.
As a final note, ensure that you understand the replication modes available in your components and databases. Synchronous modes use more resources, while asynchronous modes can lead to data loss if a pod terminates before data replication.
In Kubernetes, there is a direct correlation between database performance and resource usage (CPU and memory). Database performance can be measured in different ways, including response time, throughput and duration. Before further exploration of this concept, let’s review the difference between these metrics.
In general, the more resources you allocate to an application, the better and more quickly it performs. However, it is challenging to find the right resource settings to minimize cost while still achieving the right level of performance. Fortunately, machine learning-based optimization solutions are available to make this process easier.
For the remainder of this article, we’ll walk step by step through the process of optimizing an example database using StormForge Optimize Pro. Note that this process will be different if you’re using a different optimization solution.
The first step in the optimization process is to define which metrics to optimize. In this example, we’ll attempt to minimize cost and duration, recognizing that there are trade-offs between these two metrics.
These optimization metrics are defined below.
metrics:
  - name: cost
    minimize: true
    query: '{{ resourceRequests .Target "cpu=0.017,memory=0.000000000003" }}'
    target:
      apiVersion: v1
      kind: PodList
      matchLabels:
        app.kubernetes.io/instance: postgres-stormforge-example
        app.kubernetes.io/name: postgres
  - name: duration
    minimize: true
    query: '{{ duration .StartTime .CompletionTime }}'
Here we’ve declared two metrics — cost and duration — and set the minimize value to true for both. This ensures that our configuration is tuned to minimize both metrics.
As you might have noticed, we’re going to use PostgreSQL for our example database. Most databases provide a performance measurement benchmark utility that provides consistent results (like pgbench for PostgreSQL). Running the PostgreSQL database in Kubernetes is easier using pgbench with the operator.
The pgbench benchmarking tool executes PostgreSQL tests. To optimize benchmark duration time, we run the tests over a relatively long period. This filters out excess noise. In certain scenarios, the tests must run a few additional times to find the optimal reproducible numbers.
Furthermore, pgbench is a bottleneck when testing many sessions. You can alleviate this by running several instances of pgbench concurrently on a Kubernetes cluster.
Before we proceed with our optimization process, you will need:
minikube start --memory 5120 --cpus=4 --kubernetes-version=v1.20.1If your cluster is running and has created an account with StormForge, you can see your cluster under Manage clusters on the Cluster tab.
Now, initialize the StormForge controller by first logging in using the command line:
stormforge loginIf this does not work, use:
stormforge login --forceAfter authentication, use stormforge init to initialize the StormForge controller in your cluster and stormforge check controller to verify that your controller is running.
The output should look like this:

We’ll use a Postgres example to create a database and experiment.
The best way is to clone the repository in the local environment and change the directory to postgres. On the command line, run the following commands:
cd examples/postgres
kubectl create ns postgres

kubectl apply -f
The output should be:
experiment.optimize.stormforge.io/pg created
secret/postgres-secret created
service/postgres created
deployment.apps/postgres created
Now, check the deployments using kubectl get deployments -n postgres. You should see your deployment running:
![]()
The commands we just run deploy Postgres and configure the CPU and memory limits for our Postgres application. The StormForge controller schedules the trials using pgbench to initiate the workload on the Postgres instance.
You can view the trial runs using kubectl with this command:

Let’s further examine this output.
Our experiment includes three main components: trials, parameters and metrics. A trial is an individual run of an experiment, while a parameter is an assignment that we can tune from trial to trial in an experiment. In our application, CPU and memory were the parameters we assigned in the experiment.yaml file. When defining our parameters, we also must state the minimum (min), maximum (max), and baseline values of the parameters. The experiment.yaml file describes this as follows:
parameters:
  - name: cpu
baseline: 4000
min: 2000
max: 4000
  - name: memory
baseline: 4096
min: 2048
max: 4295
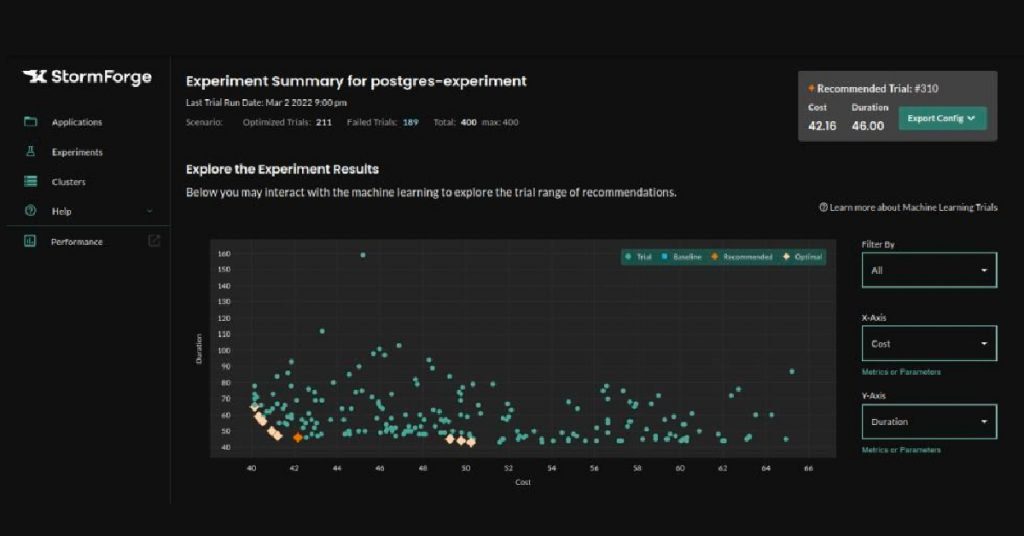
The metrics are the results of a trial in an experiment, in our case, duration and cost.
Based on these metrics, you can easily compare which trial runs offer the best trade-offs between cost and duration. This information saves precious time when determining the best cluster configurations for the database as shown in the graph below.

This article covered database performance and resource use trade-offs in Kubernetes. It examined some best practices for optimizing database performance in the cluster, including awareness of the required components, determining the suitability of database and functions, and most effectively, using synchronous and asynchronous modes to ensure efficient database performance and minimize data loss.
The article then described the trade-off between optimizing for database performance and resource use in a Kubernetes cluster. Metrics such as response time, benchmark duration and throughput are essential factors to consider. Finally, it demonstrated how a machine learning-powered optimization solution like StormForge can be used to improve cluster performance while minimizing resource usage with a database running in Kubernetes.
–
This post was originally published on The New Stack.
We use cookies to provide you with a better website experience and to analyze the site traffic. Please read our "privacy policy" for more information.