
Tuning Java workloads in Kubernetes has always been one of the most challenging parts of rightsizing. Java applications manage memory through a heap, where objects are allocated and garbage collected—making memory usage patterns fundamentally different from other languages.
Set the heap too small, and your workloads run into java.lang.OutOfMemoryErrors or suffer from excessive garbage collection. Set it too large, and you’re wasting memory—often needing to run memory-optimized nodes unnecessarily, which drives up your cloud costs.
Most rightsizing tools don't understand this nuance. They lack visibility into JVM internals like heap usage, off-heap memory, and garbage collection behavior. As a result, they can’t make safe or effective recommendations for Java-based workloads.
To address this, we’ve introduced Java workload optimization to StormForge Optimize Live. This new feature brings JVM-aware intelligence to the rightsizing process, collecting Java-specific metrics and generating tailored recommendations for:
The result: more efficient Java workloads, reduced memory waste, and fewer tuning headaches for your team.
To start receiving Java-specific recommendations, you’ll need to configure the StormForge Agent to detect Java workloads and collect JVM metrics.
There are three key pieces of configuration required:
Here’s an example configuration block to include during agent install or upgrade:
jvmWorkloadConfigs:
- labelSelector: "example.com/jvm-runtime=true"
metricsPort:
matchNumber: 9090
metricsPath: /jvm-metrics # Default is "/metrics"
Please see the documentation for full instructions on configuring Java metrics collection in your environment.
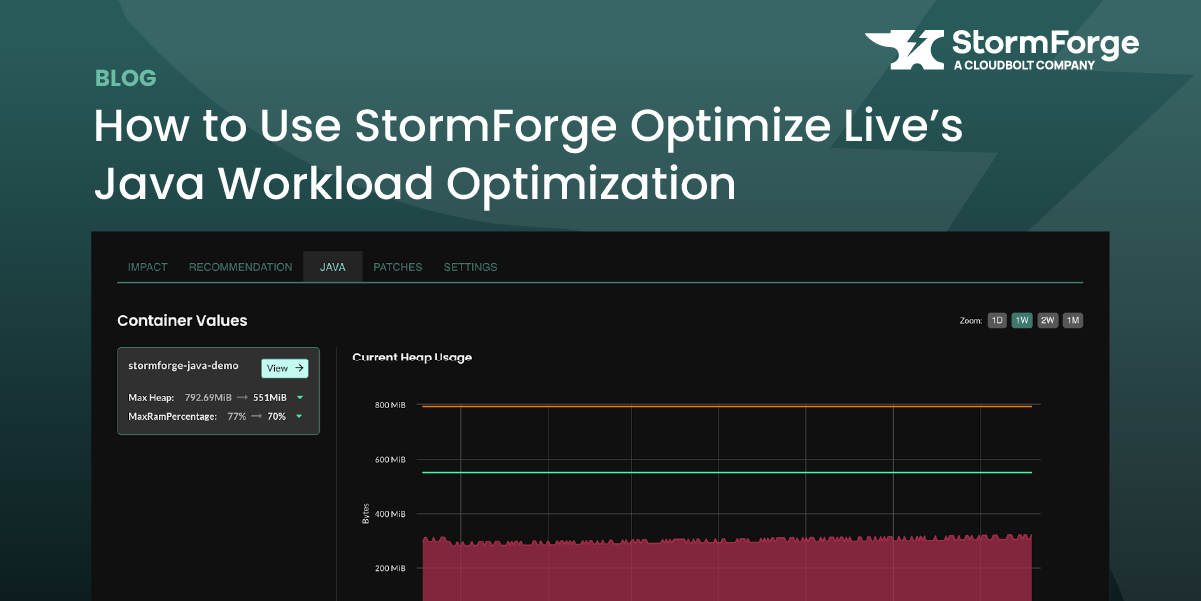
Once the agent is successfully collecting Java metrics, Optimize Live will display a new Java tab within each workload’s detail screen.
There, you’ll see:
We recommend first reviewing the heap usage history and comparing it to the recommendation. You can apply the changes manually to confirm performance and cost impact.
Once you’re confident in the recommendations, you can move those workloads to auto-deploy mode, where Java rightsizing updates are applied regularly (daily by default).
Java workload optimization brings targeted intelligence to one of the most memory-sensitive areas of Kubernetes. By understanding heap behavior and JVM memory patterns, StormForge enables safe, efficient tuning for Java-based applications—without guesswork or overprovisioning.
Ready to try it out? Start your free trial, or explore the feature in our interactive sandbox environment.
We use cookies to provide you with a better website experience and to analyze the site traffic. Please read our "privacy policy" for more information.