Optimizing pod-level resources is critical in Kubernetes—but without visibility into how those optimizations impact node and cluster-level efficiency, the story is incomplete.
StormForge Optimize Live has long focused on rightsizing workloads at the pod level, helping teams reduce overprovisioning and improve application reliability. But seeing the impact of those changes at the node layer often required digging into Application Performance Monitoring (APM) tools—if the relevant data was even available.
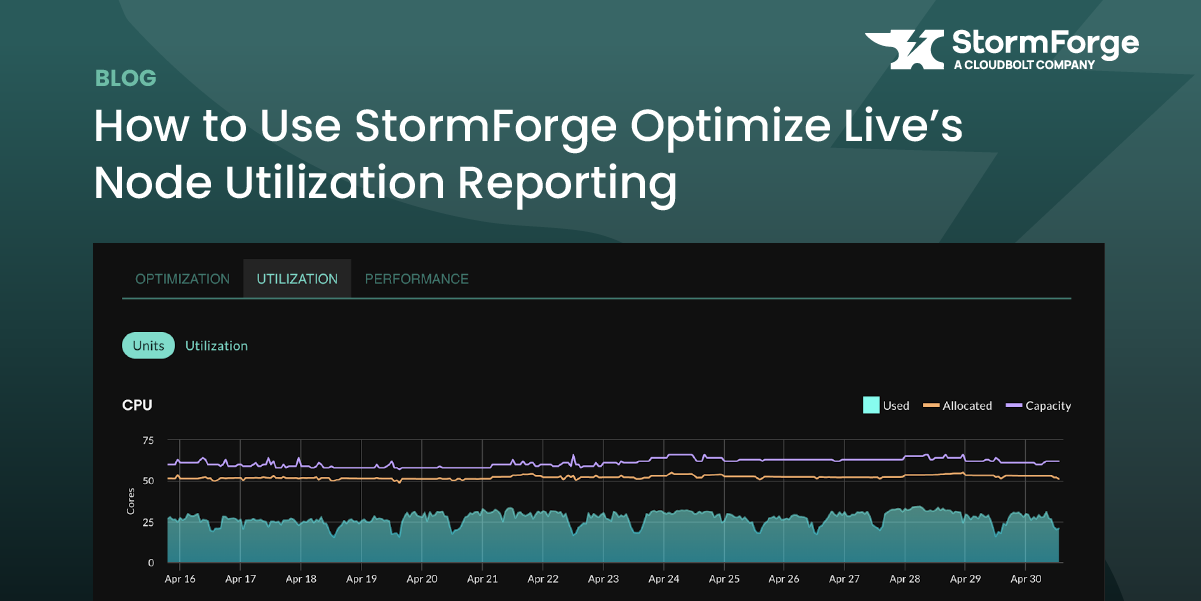
With the launch of node utilization reporting, StormForge makes it easy to observe how pod rightsizing improves overall cluster efficiency. You can now track resource allocation versus actual usage across nodes, helping you surface new opportunities for cost savings and optimization.
To use this feature, make sure you’re running StormForge Agent version 2.21.2 or later. Once installed, the agent will begin collecting data from your cluster in just a few minutes.
From there, you’ll be able to:
Quickly compare actual usage against pod requests and total node capacity. For example, if you’re seeing 10% average CPU utilization, you likely have significant room for optimization.
This view helps you identify whether you’re using more specialized nodes than needed. If memory requests are consistently low, you may be able to switch from memory-optimized nodes to general purpose instances, reducing cloud spend without sacrificing performance.
The pods per node graph highlights whether you’re maxing out pod count before fully utilizing CPU or memory. This is a common issue caused by default limits like maxPods.
You can:
This view shows a breakdown of the node instance types running in your cluster.
If you use Cluster Autoscaler, you’ll likely see a stable, limited node pool. If you use Karpenter, you’ll notice more dynamic changes in node types as workload demands fluctuate.
Previously, it was difficult to see how pod rightsizing holistically improved your cluster. With the new node utilization reporting feature in StormForge Optimize Live, you can now visualize cluster-wide impact, uncover new optimization opportunities, and take better control of your Kubernetes spend.
Ready to give it a try? Start a free trial, or explore the feature in our interactive sandbox environment.
We use cookies to provide you with a better website experience and to analyze the site traffic. Please read our "privacy policy" for more information.